Servers
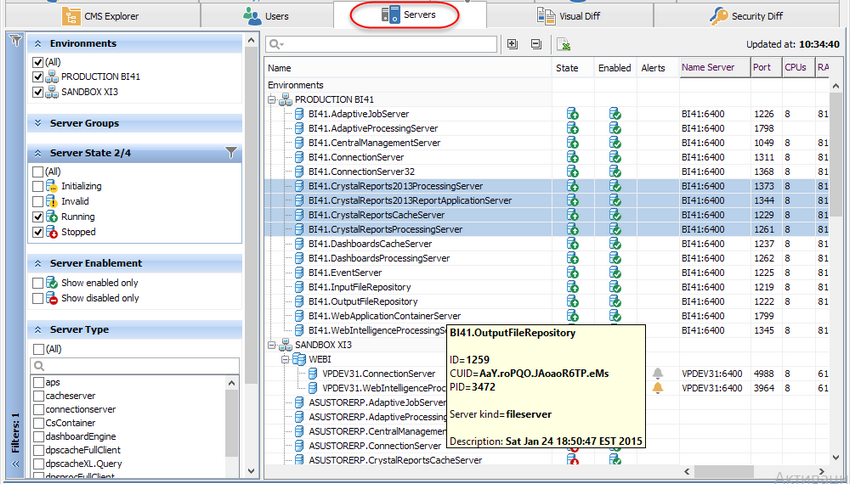
The ![]() Servers application tab in MetaMiner Client is the tool for tracking server metrics and displaying various configuration settings of your SAP BusinessObjects servers:
Servers application tab in MetaMiner Client is the tool for tracking server metrics and displaying various configuration settings of your SAP BusinessObjects servers:
What is it? |
The Servers tab provides a complete overview of SAP BusinessObjects servers and services in your BI landscape (status, state, configuration settings), and all server metrics, in near real-time. |
Why would I use it? |
To determine current server and service metrics, server utilization (for example, open connections across all Web Intelligence services). |
![]() Tip
Tip
The Servers tab updates its Content Area independently from the Reload button. It updates automatically every N seconds. This time period is controlled by the MetaMiner Server system variable Dcms.pull.metrics.period and equals to 30 seconds by default.
Note that metrics are not pre-loaded on MetaMiner Client startup. They are downloaded asynchronously. It may take some time to download all metrics.
The Servers Tab UI
The Servers tab consists of two areas:
| • | Filter Pane with many filter groups available, and |
| • | Content Area, which displays your BI data, with a context menu that appears upon right-click mouse operation and contain the only item: Properties, and a toolbar on top of the Content Area. |
You limit your source data by applying filters, Quick Search Control, and then browse the filtered data in your Servers Content Area, where it is displayed in a form of tree table (on one hand, it is a table with the columns listed below, and on another hand, a tree, where you can expand and collapse nodes).
The resulting table contains three sets of columns.
The first set is displayed for all servers, and the most general and important information is exposed there. The heading of those columns is shown with a lighter background.
The following columns belong to the first set:
Title |
Description |
Name |
The name of the current server or server group. You can change the width of this column. |
State |
|
Enabled |
|
Alerts |
Shows Shows |
The second set displays typical server metrics, available for most of the server kinds, and displayed by default.
The following columns belong to the second set:
Title |
Description |
Name Server |
CMS Name Server and port number (6400 by default). |
Port |
TCP/IP port for communicating with this server. |
CPUs |
Number of CPUs or CPU cores installed in the server. |
RAM (MB) |
Physical memory installed in the server, in megabytes. |
Disk Used |
How much hard disk space of the server is occupied. |
The third set displays server metrics. It depends on what servers are currently displayed, their Server Kind properties. The heading of those columns is with a darker gray background.
Server metrics represent the current, actual values of a server in the SAP BusinessObjects environment. For example, a Web Intelligence Processing Server may have, among other metrics, # of open connections or Cache Used. These values change constantly as the resources of the system increase and decrease from ongoing use.
MetaMiner captures these server metrics in two different locations: the Servers tab in the MetaMiner Client UI as well as directly stored to the SERVER_METRICS table in the MMDB.
![]() Tip
Tip
Because of performance constraints in retrieving server metric metadata (native operating system calls, etc. made by the BI platform to the host machine), there could be significant delay in retrieving this data. In such cases, it may be advisable to increase the delay by which these metrics are retrieved (see above). To do this, go to List of MMS System Variables and set the Dcms.pull.metrics.period variable to 600 or more.
Please consult the SAP BusinessObjects documentation for more information about server metrics.
See also