Pull Metrics
Choose Pull Metrics... from the context menu to open the Data Refresh Statistics window:
Warning
This command is available for environment objects only.
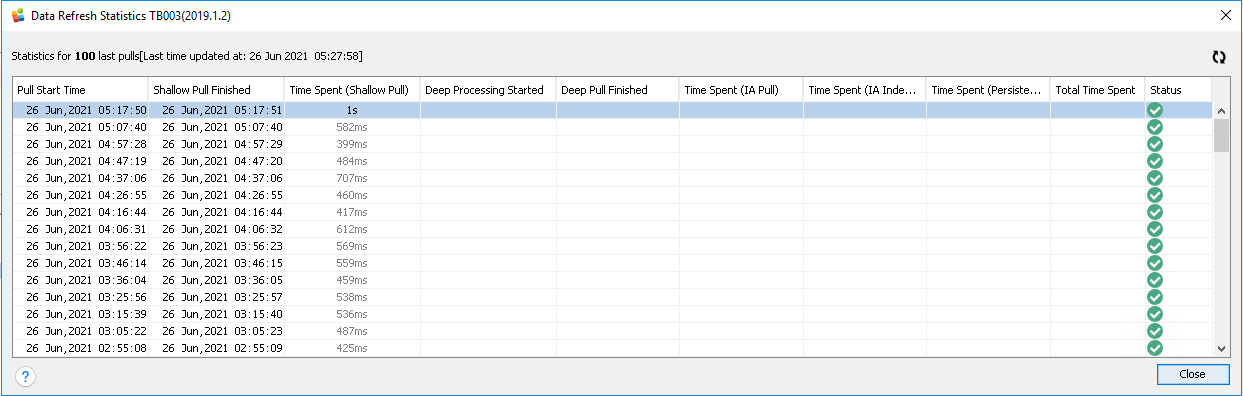
The Data Refresh Statistics window displays the action log for recent refreshes (pulls) in the selected Tableau environment.
This information is presented as a table (grid) where rows are pulls and columns are statistic metrics.
Maximum of 100 recent pulls can be displayed.
Each time you click Pull Metrics..., a new instance of the Data Refresh Statistics opens, even if the same environment is selected.
For each pull, the following statistic metrics are shown:
- Pull Start Time
- Shallow Pull Finished
- Time Spent (Shallow Pull)
- Deep Processing Started
- Deep Pull Finished
- Time Spent (IA Pull)
- Time Spent (IA Indexing)
- Time Spent (Persistence)
- Total Time Spent
- Status