Monitoring with Pulse – Introduction
MMTE includes an online monitoring service named Pulse.
It is based on Grafana and FluxDB.
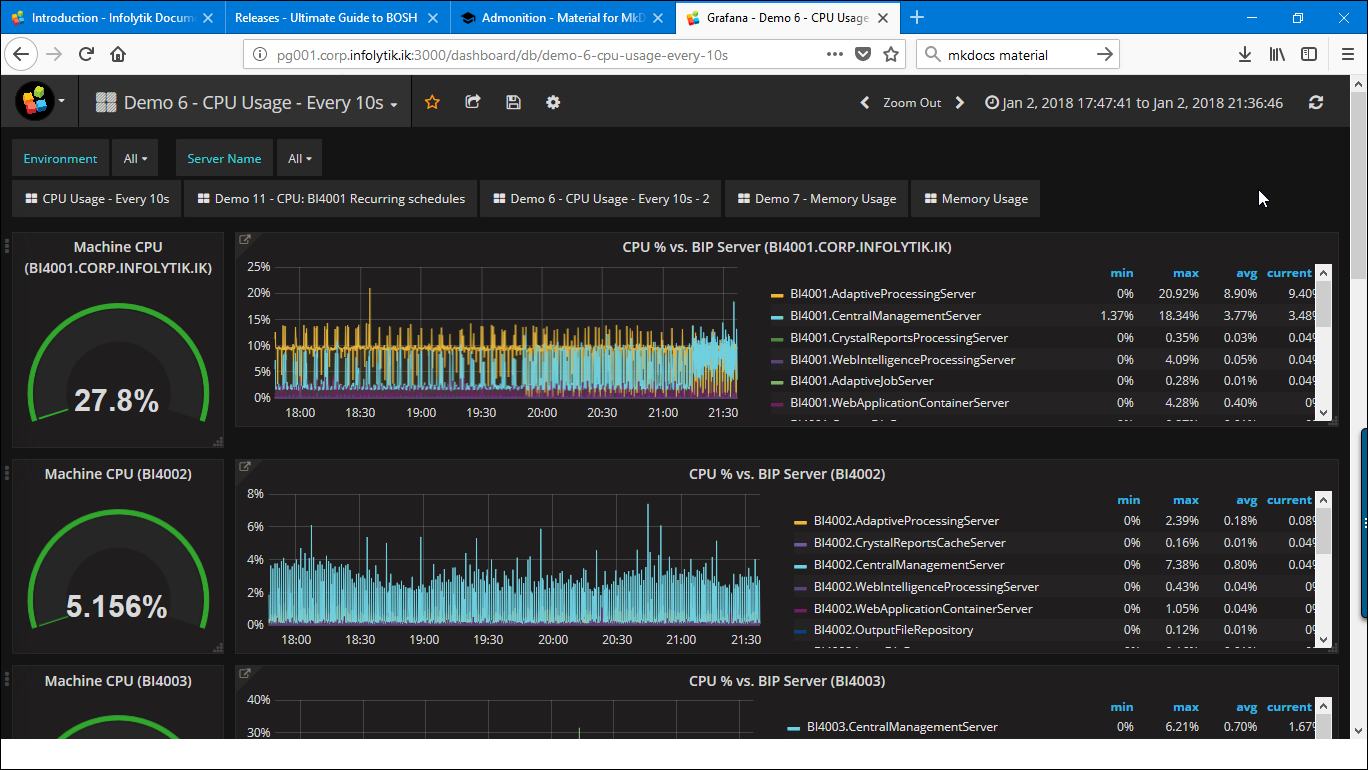
Pulse allows DataOps, DevOps, and others to quickly see, in real time, the health of their analytic platform and monitor vital statistics such as response time, memory, CPU utilization, and process-specific behavior.
It also offers visualizations of the deep correlation between system performance and resource utilization and the users and assets of your analytics platform to help answer tough questions such as:
- Are users experiencing slower dashboard response times at certain times of the week?
- Do we trigger scheduled events or extracts during peak periods of interactive use?
Installing Pulse
Pulse is installed alongside MMTE Server – there is no separate installer for it. However, not all license keys support Pulse. If you are unable to launch Pulse, then please contact Infolytik support to review your licensing arrangement.
To supply data to Pulse, you need to Install MetaMiner Remote Tableau Metrics Agent on your server(s) where Tableau Server is installed.
Launching Pulse
- Launch web browser on your workstation or a mobile device.
- Enter the following in the address bar of the browser:
<metaminer_server_host>:3000 - When the login screen appears, use the system defaults for user/password, or admin/admin You are now logged into Pulse.
Firewall Requirements for Pulse
Pulse is hosted internally at the same host as MMTE Server and uses TCP/IP port 3000 by default. This port must be open in order for users to connect to Pulse.
Testing Sample Dashboard
The following video will walk you through this process from importing to testing a new dashboard:
Choose Import Dashboard:
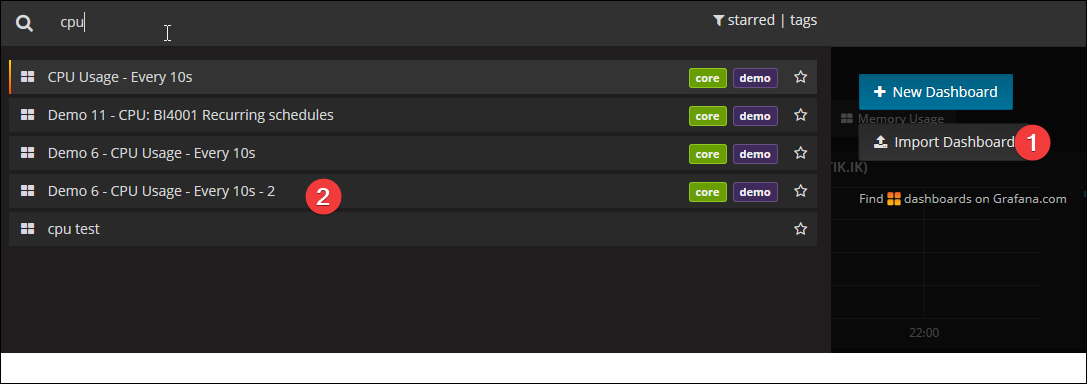
Now, go to the dashboard drop-down to confirm the new dashboard is present:
Configuring
When configuring Pulse, the following configuration files need to be considered:
/tabagent/mmagent.config (TabAgent side)
/tabagent/tabagent.ini (TabAgent side)
/grafana/conf/*.ini (MMTE Server side)