Difference Visualization View
The Difference Visualization View in the Visual Diff tab in both modes (Data, Users) consists of the following areas:
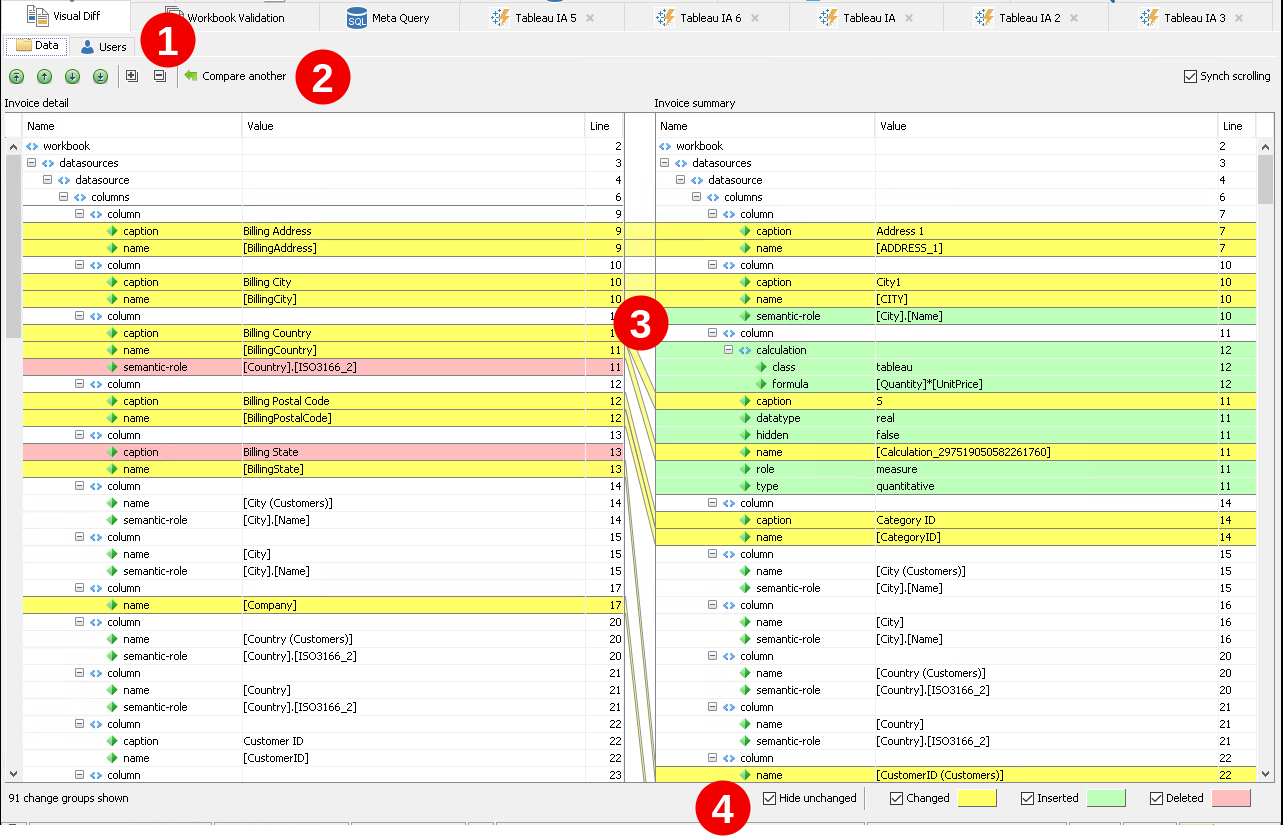
 Data/Users mode tabs
 Toolbar with available commands
 Tree views of differences between targets
 Legend with checkboxes for filtering displayed differences. Set/unset these checkboxes to view/hide unchanged, changed, inserted, or deleted content. There is also a counter of changes found which is located at the bottom of the View.
Toolbar
The difference scroll toolbar of the Visual Diff Visualization View is located on top of the Content Area and contains the following commands:
| Icon | Command | Description |
|---|---|---|
| Goto the first change | Scroll tree views up to the first difference detected. This icon is displayed in gray if the view is already positioned at the first change. If Sync scrolling is checked, then both views are scrolled, otherwise, the left view only. | |
| Goto the previous change | Scroll tree views up to the previous difference detected. This icon is displayed in gray if the view is positioned at the first change. If Sync scrolling is checked, then both views are scrolled, otherwise, the left view only. | |
| Goto the next change | Scroll tree views down to the next difference detected. This icon is displayed in gray if the view is positioned at the last change. If Sync scrolling is checked, then both views are scrolled, otherwise, the left view only. | |
| Goto the last change | Scroll tree views down to the last difference detected. This icon is displayed in gray if the view is already positioned at the last change. If Sync scrolling is checked, then both views are scrolled, otherwise, the left view only. | |
| Expand All | Expand all nodes in the tree views. | |
| Collapse All | Collapse all nodes in the tree views. | |
| Compare another | To switch back to the Initial View, click Compare another. | |
| Sync scrolling | Set this checkbox to scroll left and right tree views synchronously (if you scroll one of them to another change, the opposite one will be repositioned automatically in this mode). |
Tree Views
This is the main area of the Difference Visualization View in Visual Diff. It consists of two major blocks, left and right, which represent two selected targets:
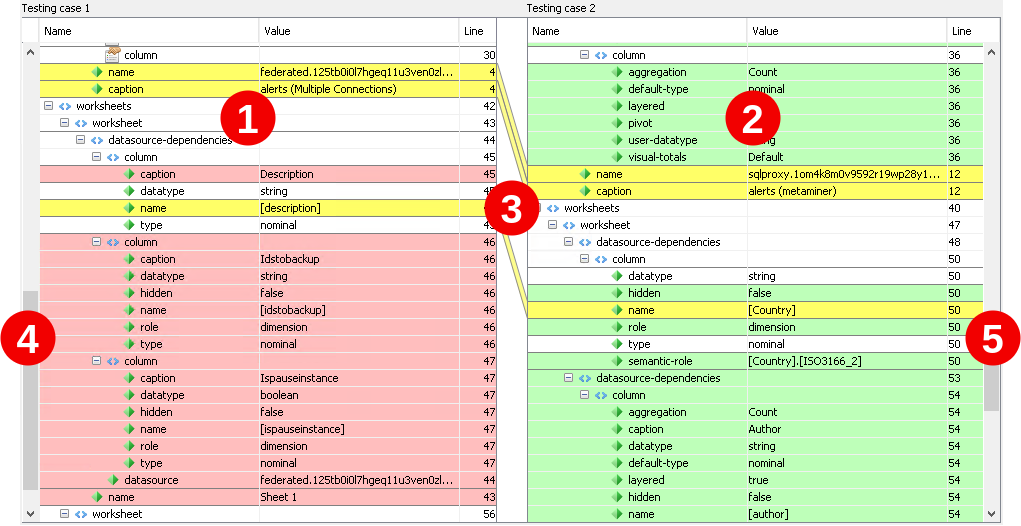
In Tree Views, the BI data under selected targets is displayed as two tree structures.
Each object in the left area is linked with some place in the tree of the right area , and vice versa. Those links are displayed as lines between the areas.
There are two scroll bars: one for the left area , another for the right one  . If the Sync scrolling option is enabled, then scrolling any of those two scroll bars causes scrolling of another area too.
You can scroll the tree views of any compared target independently, and MMTE Client automatically tracks relation of currently displayed data to another target. You can also collapse and expand any container in any of those tree views.
Color Indication
Each object in these tree views is marked with one of the following background colors:
| Color | Status | Matching |
|---|---|---|
White |
Unchanged | Matches 100% |
Yellow |
Changed | Matches >0%, <100% Objects in this status have additional command(s) available on the context menu: * Copy * Show Change Details * View Value |
Green |
Inserted | Exists in the right target, completely missing in the left one Objects in this status have additional command(s) available on the context menu: * Copy * View Value |
Red |
Deleted | Missing in the right target, exists in the left one Objects in this status have additional command(s) available on the context menu: * Copy * View Value |
All folders have the following additional context menu commands: Zoom In, Zoom Out.
About Sorting
Structural nodes sharing the same type and hierarchy level in the left area are sorted alphabetically.
Structural nodes of different types are sorted always in the same order. For example, if you have a data source and a sheet in your workbook, the data source comes first.
User groups and user accounts in the left area are sorted alphabetically.
When comparing business objects, inner elements of the object in the left area are shown in the same order as they are stored inside of the object. Object properties sharing the same type and structural level are sorted alphatetically.
Objects in the right area are sorted to match the left tree and to avoid crossing of link lines.
If you swap targets, white objects stay white, yellow ones stay yellow, red ones become green, green – red, and sorting changes.
Context Menu
The Visual Diff tab in Data mode in Diff Visualization state offers a number of commands in the context menu.
The context menu is accessed by right-clicking on one or more selected rows in the tree view.
You can use the following commands:
See Also